

Checklist for Keeping Your Workplace Unified



Robin’s Workplace Friction Report surveyed 514 workplace operations professionals and scored their organizations on the Workplace Friction Index, a 100-point measure of how much friction shows up in daily office life. That score sorted every organization into one of three tiers: Reactive, Fragmented, or Unified.
Unified is the top tier, the smallest of the three, and the place every workplace team is working toward.
This post is for the organizations that are already there. Consider it a maintenance guide. It picks up right where the work of getting Unified leaves off and walks through how to protect it.
Unity Is a Journey, Not a Destination
Let's start with the good news: if you've reached Unified status, that's a real accomplishment. You’ve built something most workplace teams never manage to build.
But here's the catch. Sixty percent of workplace operations professionals say friction got worse over the past year, across organizations at every stage, not just the fragmented ones. Unified is a state you maintain, the same way a healthy team, a clean codebase, or a good relationship stays healthy: through regular attention, applied consistently, rather than a single fix you make once and forget.
Based on what we’ve seen, the organizations that stay Unified consistently evaluate their workplace to make sure it stays up to par. If you want to build that habit, here’s a checklist you can use to do so.
If you're not sure where your organization stands today, start with this quiz to find your Workplace Friction Index score. If you already know you're still working out the kinks, use our audit guide instead, and come back here once your system is up and running smoothly.
How Unified Workplaces Fall Apart
Fragmentation almost never happens as one big event. Nobody wakes up and decides to break a working system. It builds up through small decisions, made one at a time, each one reasonable on its own: an AV upgrade that quietly breaks the room system's integration, a policy change that gets communicated to one department but not another, a team-level tool someone adopted last quarter because it solved their immediate problem.
None of those decisions look like a threat in the moment. Add them up over two quarters, and you have a fragmented workplace again, minus the dramatic failure that would have made it obvious sooner.
Here's the thing in your favor: workplace operations sit closer to the action than almost anyone else in the building. You see the systems, the escalations, the repeat complaints. You're usually the first person who could catch a problem, if you know what to look for.
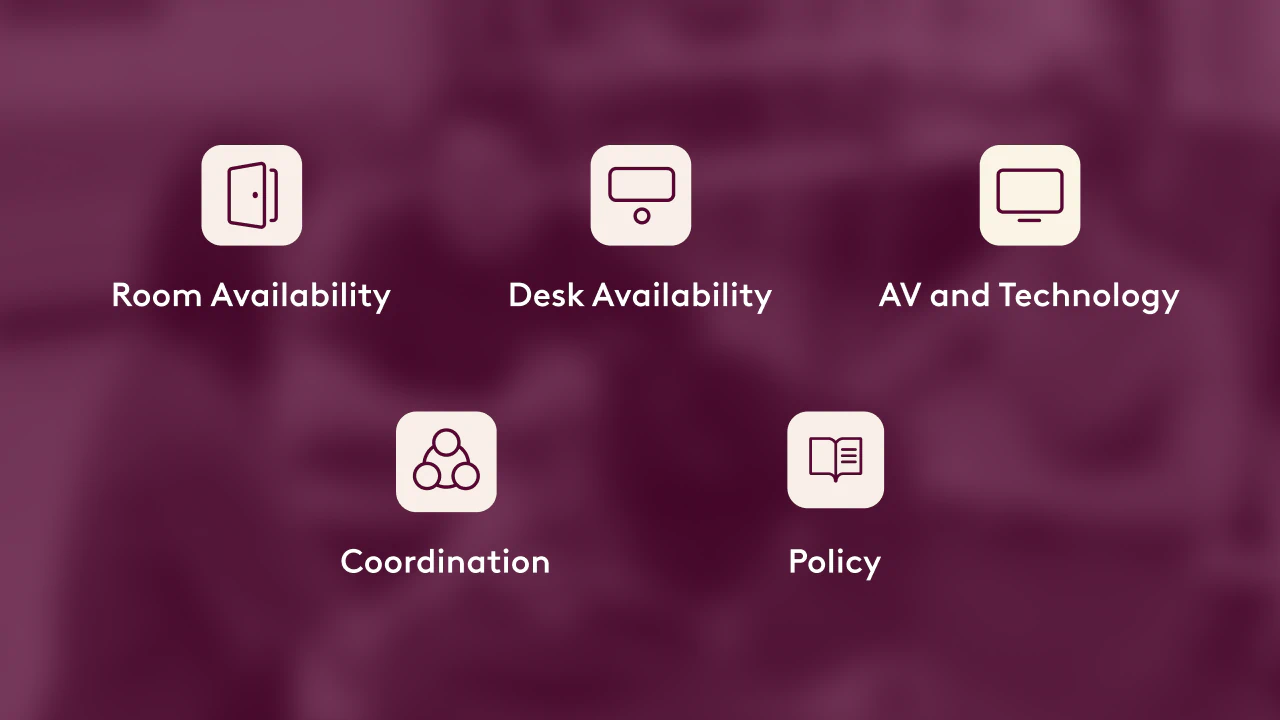
The checklist below tells you what to look for, across the five dimensions that make up a healthy workplace: Room Availability, Desk Availability, AV and Technology, Coordination, and Policy. We'll walk through what to track for each one, then show you what to do with what you find.
The Early Warning Checklist
Room Availability
- Is the ghost-meeting rate or the last-minute cancellation rate creeping up?
- Are people reporting they can't find a room, even when the data shows availability?
That gap between what your data says and what people experience is often the earliest sign of drift, well before the numbers themselves move.
Desk Availability
- Are people showing up without a reservation and wandering the floor in search of an open seat?
- Does your occupancy data show clustering that no longer matches how the floor actually gets used like whole neighborhoods sitting empty while people crowd into the same few rows?
Either signal alone might be noise. Both together, rising desk-hunting paired with a widening mismatch between reserved and actual usage, is usually the first sign that your desk data has stopped reflecting reality.
AV and Technology
- Is IT ticket volume for connectivity or display issues climbing month over month?
- Are meetings starting late, or relocating mid-meeting, because a screen won't connect or a mic won't pair?
This dimension tends to move fast once it starts, since one outdated piece of hardware or a missed firmware update can generate tickets across dozens of rooms at once. A slow climb in tickets is easier to catch than the moment everything breaks at once, so don't wait for the dramatic failure to take it seriously.
Coordination
- Is the "ghost colleague" problem reappearing, people showing up expecting coworkers who simply aren't there?
- Is day-to-day attendance getting harder to predict, with fewer people able to say who will actually be in the building on a given day?
Coordination breakdowns rarely show up in a ticket system the way AV or room issues do. You'll usually hear about this one anecdotally, in a hallway conversation or a stray comment, well before it shows up in any dashboard, so take the anecdotes seriously.
Policy
- Are hybrid-policy questions or escalations resurfacing after months of quiet?
- Is policy being applied consistently across floors and teams, or has it started to drift by department, with one team enforcing an in-office minimum that another has quietly stopped tracking?
Policy drift is the hardest of the five to spot from data alone, because the numbers can look fine even as enforcement gets inconsistent. This is the one dimension where you may need to ask managers directly, rather than wait for the data to tell you.

Cross-Cutting Signals
A few signals don't belong to any single dimension. Watch for these across the whole system, not just within one category.
- Any team-level tool adopted in the last six months that isn't integrated with your core platform. This is how fragmentation usually re-enters a Unified organization.
- Workaround behavior returning. Meetings defaulting to virtual by habit. People claiming space informally instead of booking it. These are the same workarounds that show up in Reactive organizations, just in smaller doses.
- The gap between your data and employee-reported experience is widening. The baseline across organizations in our research sits around 13 points. A widening gap, even while your individual dimension scores hold steady, is often the leading indicator that something is about to show up in the numbers.
Triage: What to Do With What You Find
For each signal you flagged above, run it through three questions.
The point of this triage is to sort what needs a quick repair from what needs real investigation, so you spend your limited attention where it actually matters instead of treating every flagged signal as equally urgent.
Quarterly Action Steps
- Pull the data. Room booking history, IT ticket trends, and occupancy reports, going back three months. Three months is enough to reveal a trend without drowning you in noise, and it keeps your comparison window consistent from one quarter to the next.
- Talk to people. One workplace operations team member plus one end user per team. Ask everyone the same question: "Where has friction shown up in the office for you in the last 30 days?" Keep it open-ended and consistent across every conversation
- Audit tools. List any team-level software adopted in the last six months that isn't connected to your core platform. Check with IT or procurement if you're not confident you've caught everything, teams don't always route new software through the usual channels. Even one unconnected tool is worth flagging, since that's exactly how fragmentation re-enters an otherwise Unified organization.
- Re-run your WFI score. Compare it to your last score using this quiz or your internal tracking. A small movement quarter over quarter is normal. A consistent upward trend across two or three quarters is the pattern worth acting on, even if no single number looks alarming yet.
- Log it. Note what changed since last quarter, new tools, policy updates, staffing changes, office moves, so you're tracking trends over time instead of comparing disconnected snapshots.
- Attach this to something recurring. A platform review, a leadership update, an annual strategy session. Give it a home on the calendar so it doesn't need its own meeting to survive. A checklist that depends on someone remembering to run it tends to quietly disappear after two or three quarters; while one attached to a meeting that's already happening tends to stick.
Quick Reference: Green Flags vs. Red Flags
Not sure whether a signal you've spotted deserves action? Use this table to quickly sort what's healthy from what needs a closer look, dimension by dimension.
What Staying Unified Is Worth
In Unified organizations, only 14% of employees say friction is a noticeable drag on their productivity. In Reactive organizations, 63% say the same thing. That gap doesn't hold on its own, so make sure to run your quarterly assessment using the checklist above and you'll catch the slips before they compound.
Robin's visibility layer surfaces these signals automatically, so you're not waiting for complaints to tell you something has slipped. See how in a demo.